2021 QSEHRA Annual Report on Nonprofit Organizations
Infographic • June 3, 2021 at 9:38 AM • Written by: Nick Green
We're back with our third annual QSEHRA report on nonprofit organizations (NPOs) to show how they used the benefit in 2020 and compare that to previous years tp unearth YOY trends.
In our 2021 report, we aggregated data from more than 200 of our NPO customers to show allowances, reimbursements, and employee engagement broken down by organization size and employee family status.
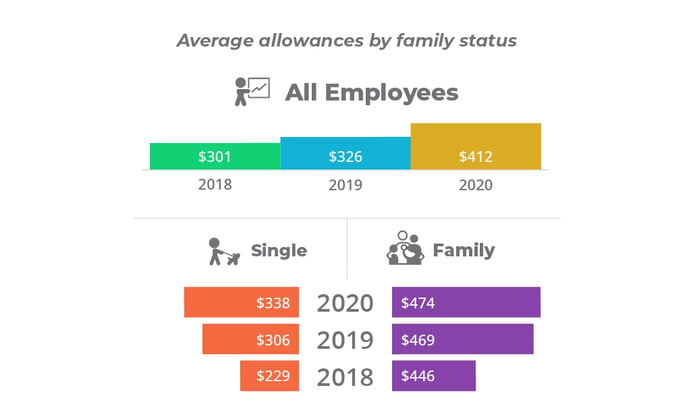
Average allowances by family status
The overall allowance increased by more than 26% in 2020, from $326 to $412. Considering the economic landscape last year, we were surprised to see such a large increase in allowances.
The largest increase came from single employees, whose allowance jumped by $32 in 2020. When compared with 2018 allowances, single employee allowances have increased by almost 50%.

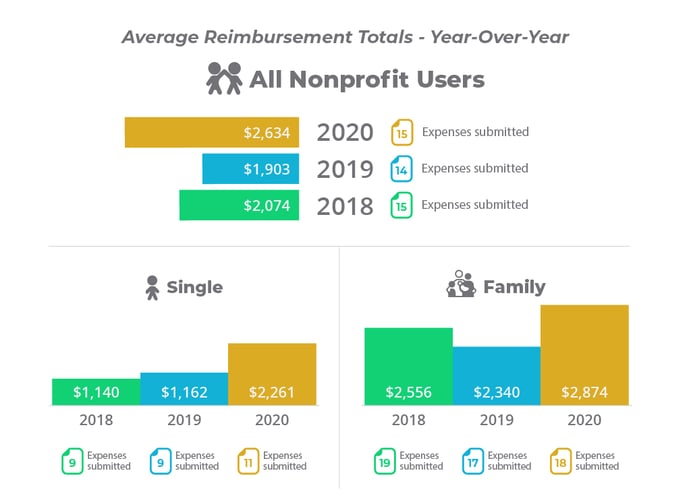
Average reimbursement totals
Reimbursements were at an all-time high in 2020, increasing by more than 38% YOY. While both single employees and employees with families were reimbursed more in 2020 than in 2019, the 95% increase in reimbursements for single employees was the main driving factor, potentially caused by greater QSEHRA participation due to the lowered cost of health insurance with expanded premium tax credits and increased healthcare consumption from COVID-related causes.
The average number of expenses slightly increased, again likely due to the reasons mentioned above.

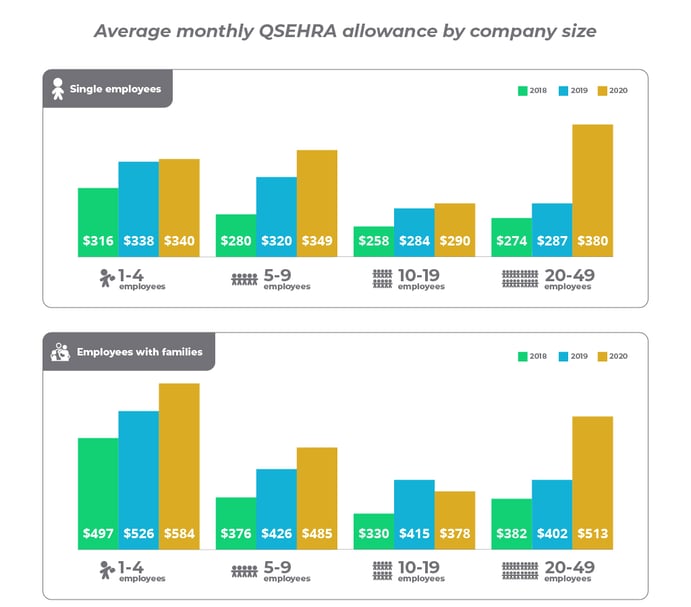
Average monthly QSEHRA allowance by company size
We saw some interesting bucking of trends when we broke down allowances by organization size. In prior years, allowances decrease as the number of employees goes up. Not so in 2020.
Single employees at organizations with 20-49 employees—usually the second-lowest group in terms of allowances—were offered the most in allowances in 2020. Their allowances increased by almost $100, from $287 to $380. Single employees at organizations with 1-4 employees—usually the group with the highest allowances—were offered the third-highest allowances in 2020 even though they slightly increased from 2019 numbers.
When we looked at employees with families, it all looked normal until we got to the 20-49 employee segment. Similarly to what we saw with the single employee allowances, there was a large spike (28%) in allowances in this segment, bringing their average offered allowance to the second-highest total after employees at organizations with 1-4 employees.

Percentage of allowance amounts used on insurance premiums
We like to look at the percentage of allowances that employees spend on insurance premiums to understand how the cost of health insurance premiums relates to allowances and see if employers like to give employees enough to cover only an insurance premium or if they add additional funds to leave room for out-of-pocket expenses as well.
In 2020, employees who had a verified insurance premium used an average of 77% of their allowance on their premium, leaving an excess of 23% to use on out-of-pocket expenses like doctor's visits, prescription medication, and mental health counseling.

Another way to see how allowances and insurance premiums are related is to look at the percentage of employees who use their entire allowance on premiums. 44% of employees who submitted a premium used their entire allowance on their insurance premium, so the slight majority of employees with premiums have leftover allowances after being reimbursed for their premiums.

